Virtual Machine (VM) Monitoring
Default Monitoring Parameters and Alert Triggers
Default Server Monitoring Parameters and Alert Trigger Conditions:
| Parameter | Description | Threshold | Alert |
|---|---|---|---|
| CPU Usage | Percentage of CPU utilization. If it reaches abnormal levels, common causes may include abnormal service, excessive parallel computation, or improper resource allocation. | > 85% | ✓ |
| Memory Usage | Percentage of memory utilization. If it reaches abnormal levels, common causes may include memory leaks, application requirements exceeding configuration, or too many processes running simultaneously. | > 85% | ✓ |
| Disk Usage | Percentage of disk utilization. If it reaches abnormal levels, common causes may include oversized log files, accumulation of temporary files, or excessive data writing. | > 85% | ✓ |
| Config Check | Verifies whether CPU, Memory, Disk, and Network are correctly configured. If not, possible causes include newly added or missing devices. | Mismatch | ✓ |
| Sys. Status | Confirms whether the monitored VM continuously uploads or updates logs within the specified time. The standard interval is 120 seconds. If no upload or update occurs, possible causes may include device malfunction or shutdown. This is considered a critical incident and should be resolved immediately. | NoUpdate | ✓ |
| Service | Checks service port connectivity defined by the user to confirm whether the VM is properly running its monitoring services. If failed, recheck whether the assigned port is enabled to execute the monitoring service. | Fail | ✓ |
| Download/Upload | Displays network upload and download speeds. If they reach abnormal levels, two scenarios may apply::
| >500MB/s | ✓ |
| Health | Monitors the overall health status of the virtual machine. | Unhealthy | ✓ |
Alert Notifications
By default, alerts are sent via email to your company’s designated contact.
If subscribed to the 24/7 NOC monitoring service, critical incidents trigger a phone call from DCT NOC team.
Viewing System Event Logs (SEL)
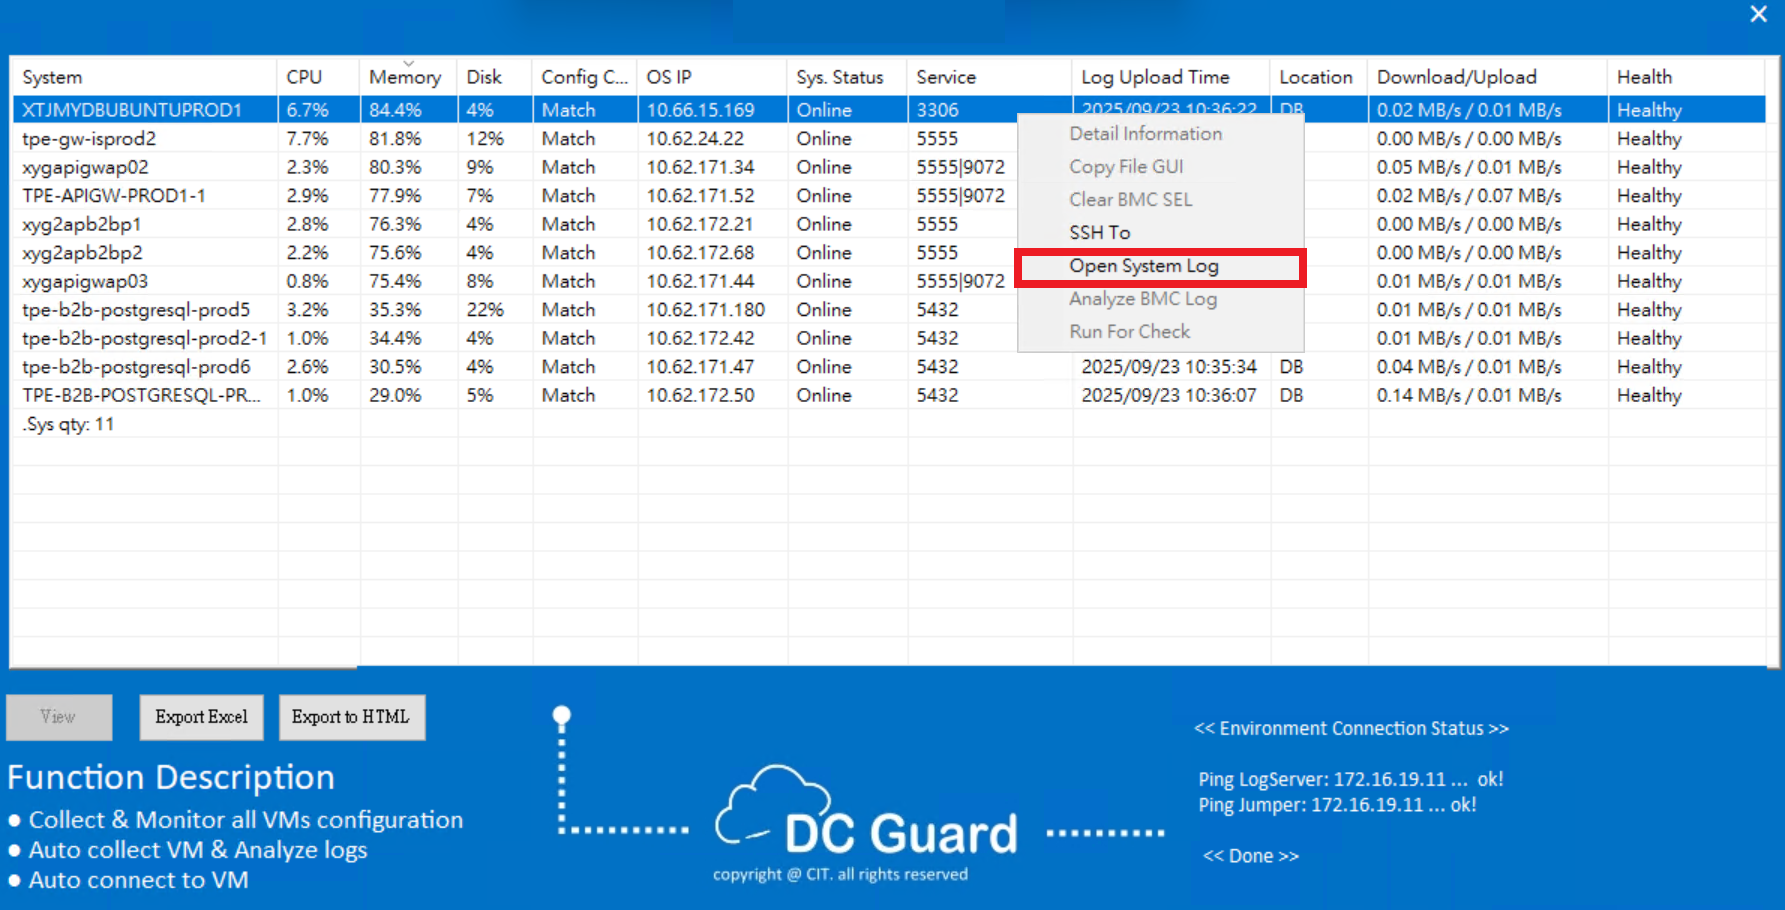
Right-click the affected device row → Open system log to view the SEL log.
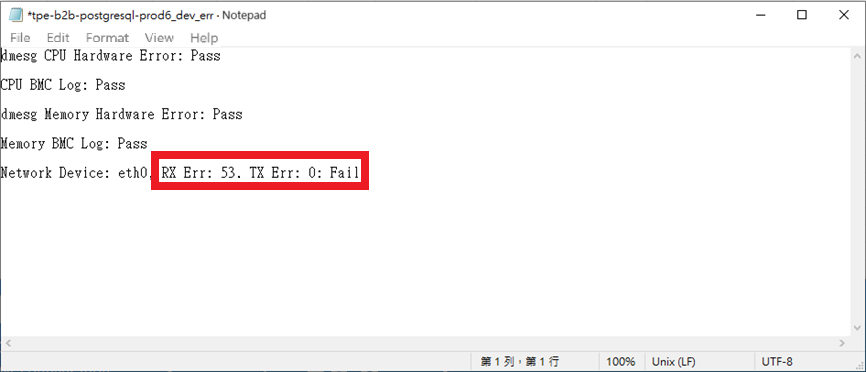
Identify error causes.
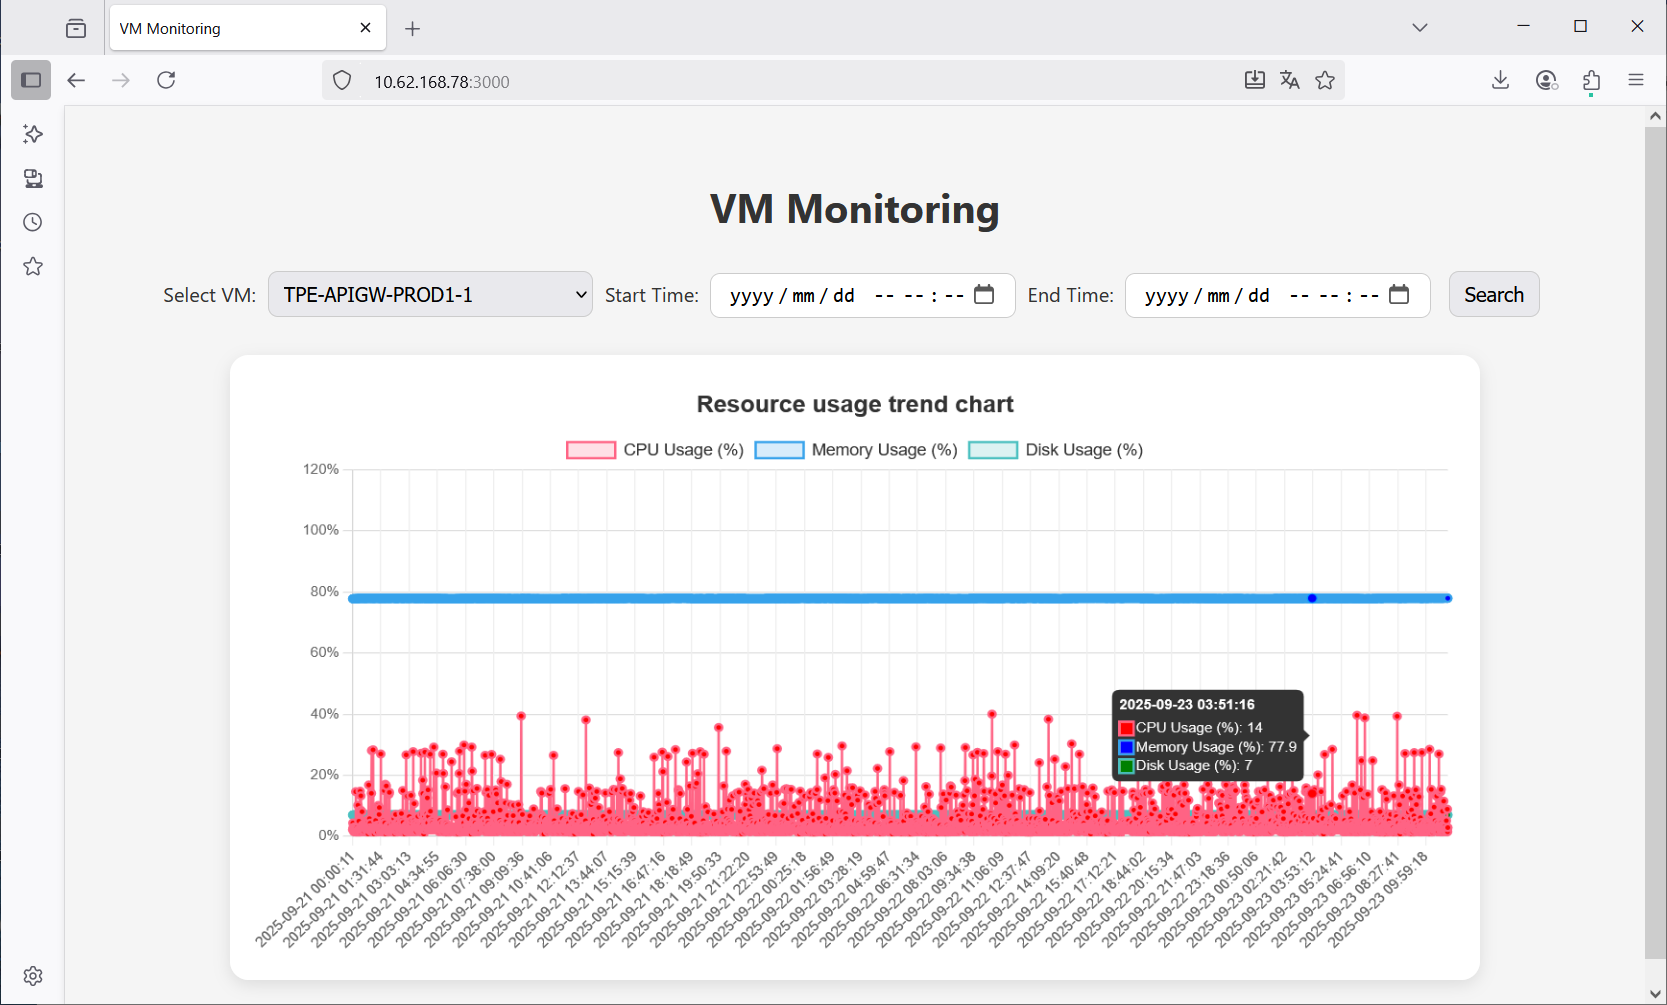
Resource Usage Timeline Chart
Enter your server IP + “:3000” in the browser (e.g., 10.62.168.78:3000) to access the timeline dashboard showing CPU, memory, and disk usage trends.