Server Monitoring
Default Monitoring Parameters and Alert Triggers
Default Server Monitoring Parameters and Alert Trigger Conditions:
| Parameter | Description | Threshold | Alert |
|---|---|---|---|
| Dmesg | Checks system hardware, drivers, and kernel-level errors such as temperature, ASIC, or interface failures. If abnormalities occur, they may result from kernel or driver-reported failures, probe errors, I/O operation failures, insufficient resources, or incompatibility. | Fail | ✓ |
| Configuration Check (Config Check) | Verifies whether CPU, Memory, Disk, and Network are correctly configured. If abnormal, possible causes include newly added or missing devices. | Mismatch | ✓ |
| System Status (Sys. Check) | Confirms whether the monitored devices continuously upload or update logs within the specified time. The standard interval is 120 seconds. If no upload or update occurs, the possible cause may be device failure or shutdown. This is considered a critical incident and should be addressed immediately. | NoUpdate | ✓ |
| BMC SEL | Checks whether the collected BMC Log contains error messages, including CPU, memory (ECC), disk, and other information collected from BMC Logs. If abnormal, possible causes include power or hardware failure, memory error, thermal issues, storage device faults, network interface errors, or system and firmware events. Further troubleshooting can be performed through DC Guard’s Log Analysis function. | Fail | ✓ |
| Temperature (Temp) | Overview the temperature of monitored devices. If temperature exceeds normal range, check whether the chassis or environmental temperature is abnormal. | > 60°C or < 10°C | ✓ |
| Health | Overall system health. | Unhealthy | ✓ |
Alert Notifications
By default, alerts are sent via email to your company’s designated contact. If subscribed to the 24/7 NOC monitoring service, critical incidents trigger a phone call from DCT NOC team.
Viewing System Event Logs (SEL)
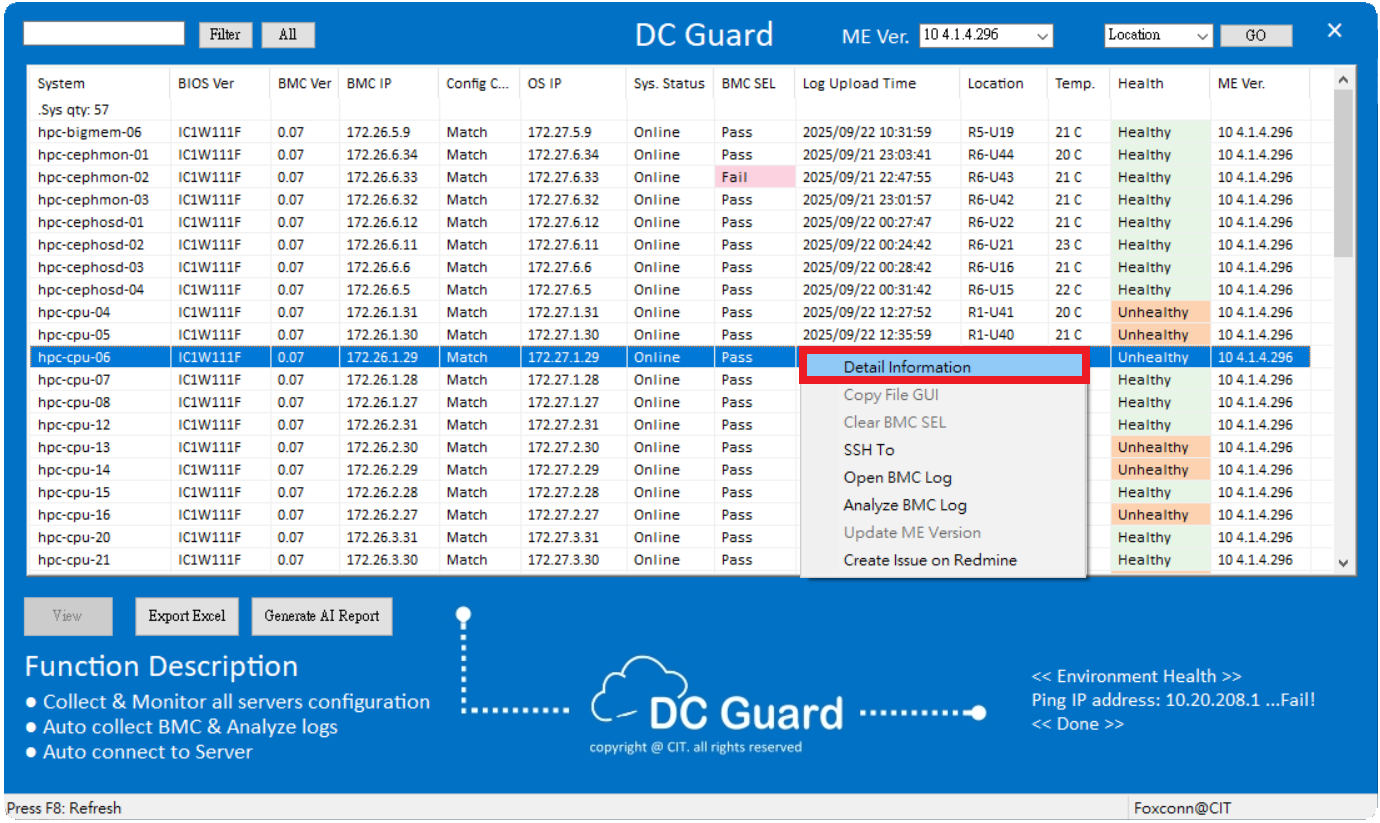
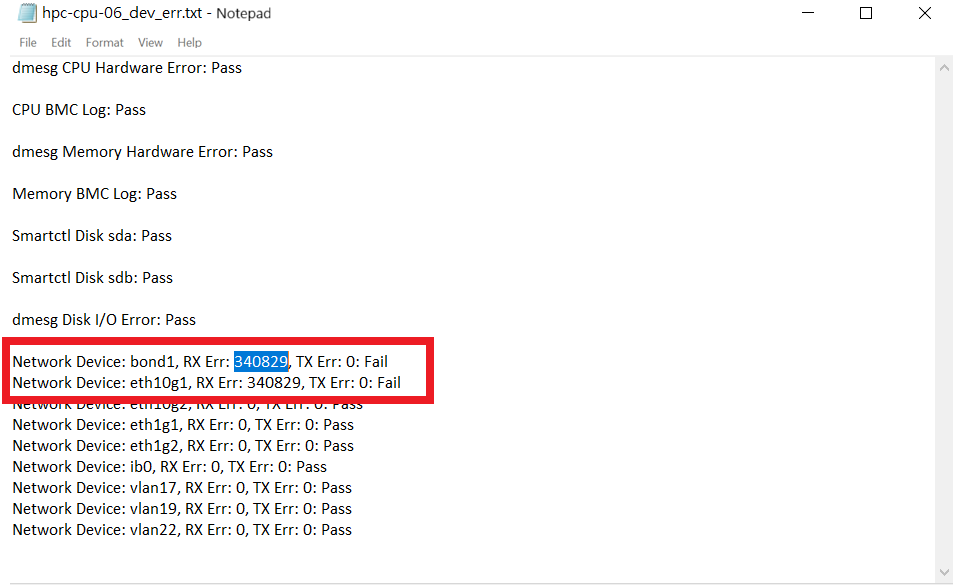
Right-click the affected device row → Detail Information to view the SEL log.
Identify error causes.
Viewing Baseboard Management Controller Logs (BMC)
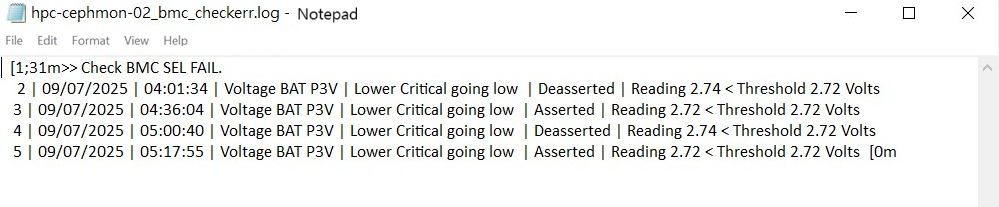
If an abnormal event occurs, right-click anywhere on the row of the affected device to open the action menu. Select “Open BMC Log” to view the log.
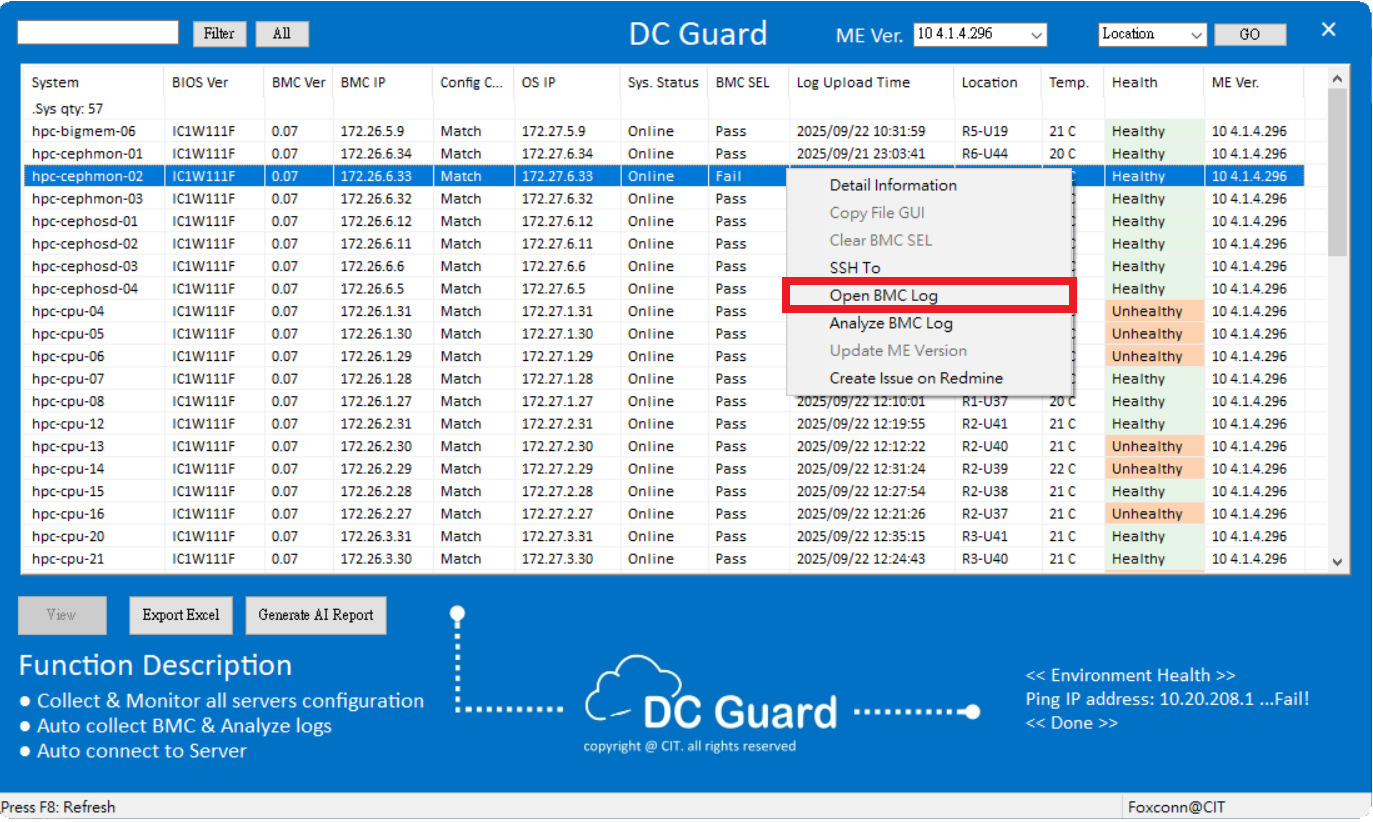
The correct BMC Log interface should appear as shown below.
BMC Log Auto Analysis
DC Guard features a comprehensive built-in database system. When an abnormal BMC Log is detected, right-click anywhere on the row of the affected device to open the action menu.
Select “Analyze BMC Log” to enter the window.
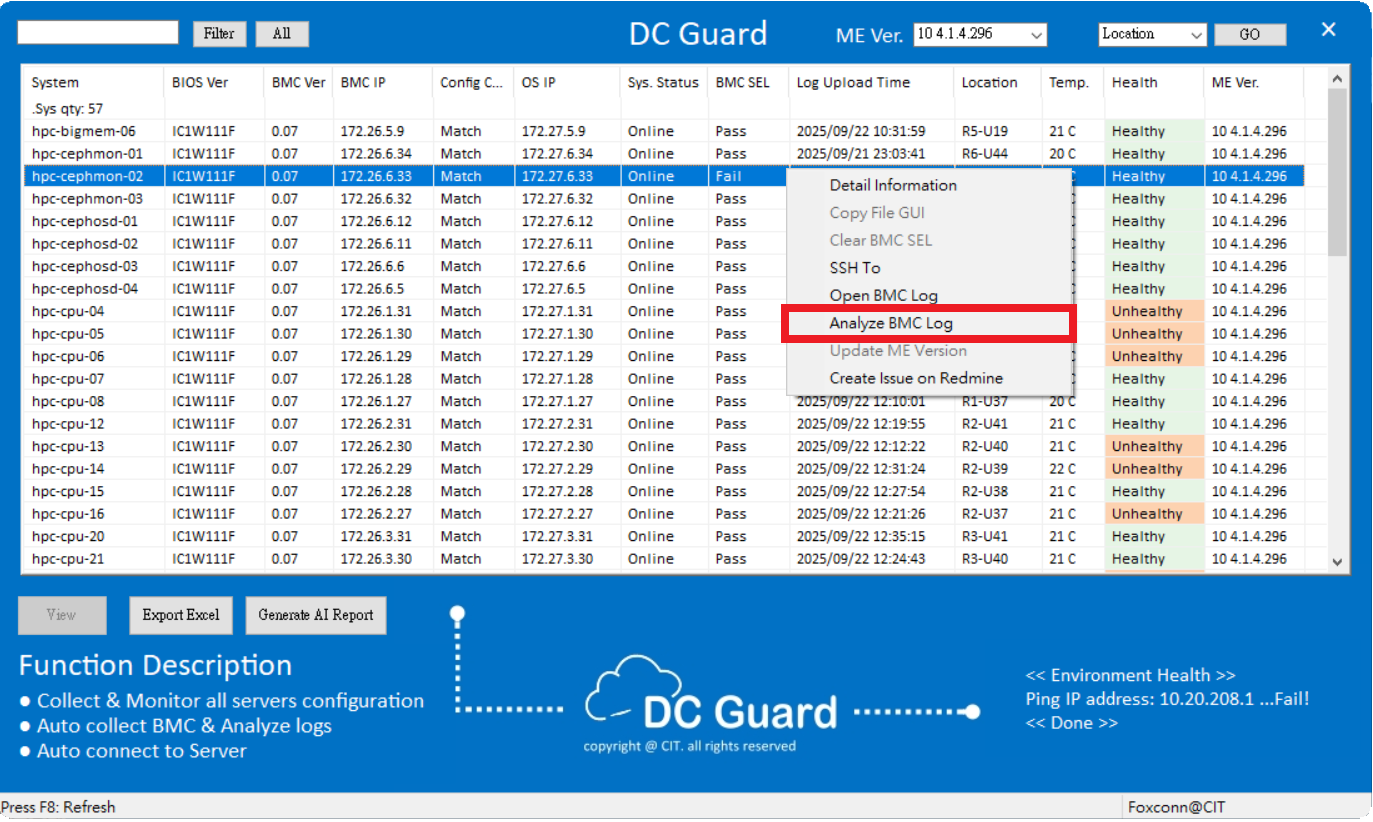
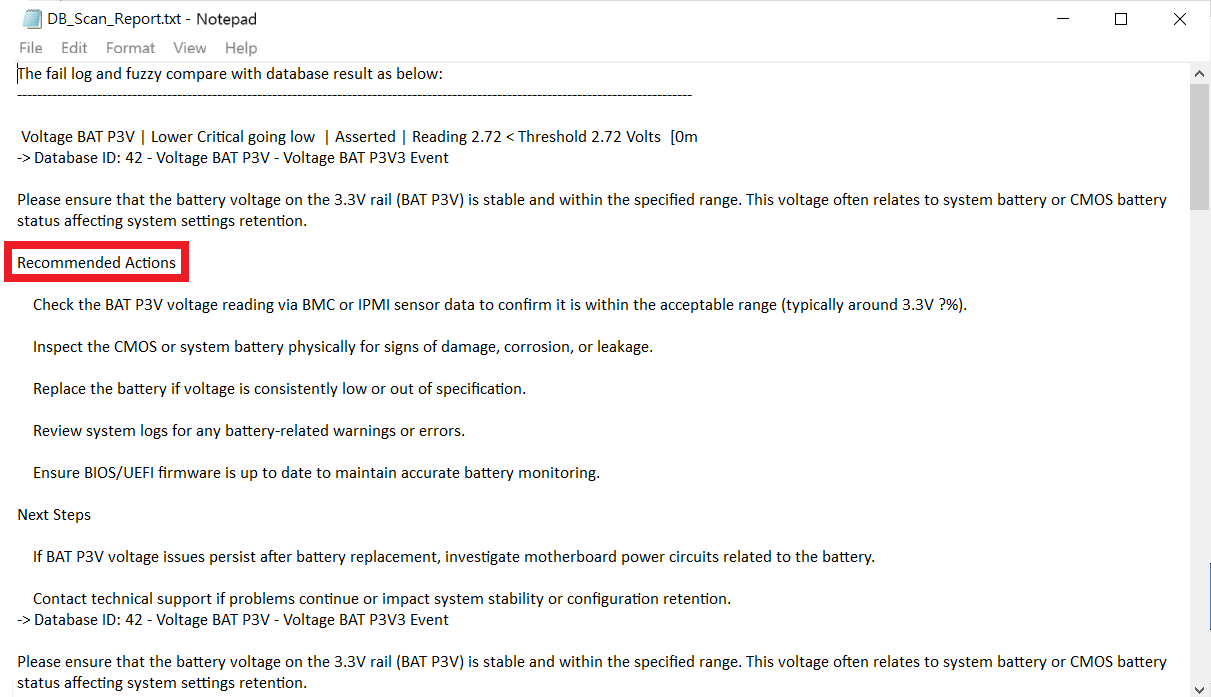
DC Guard will automatically analyze and compare the abnormal BMC Log data with its internal database, then generate troubleshooting solutions and recommendations accordingly.
BMC Log AI Report
To help synchronize information between your IT department and decision-makers more efficiently, the AI Report function can semantically generate a detailed report based on the analyzed BMC Log.
Click “Generate AI Report” at the bottom of the dashboard to export the report.
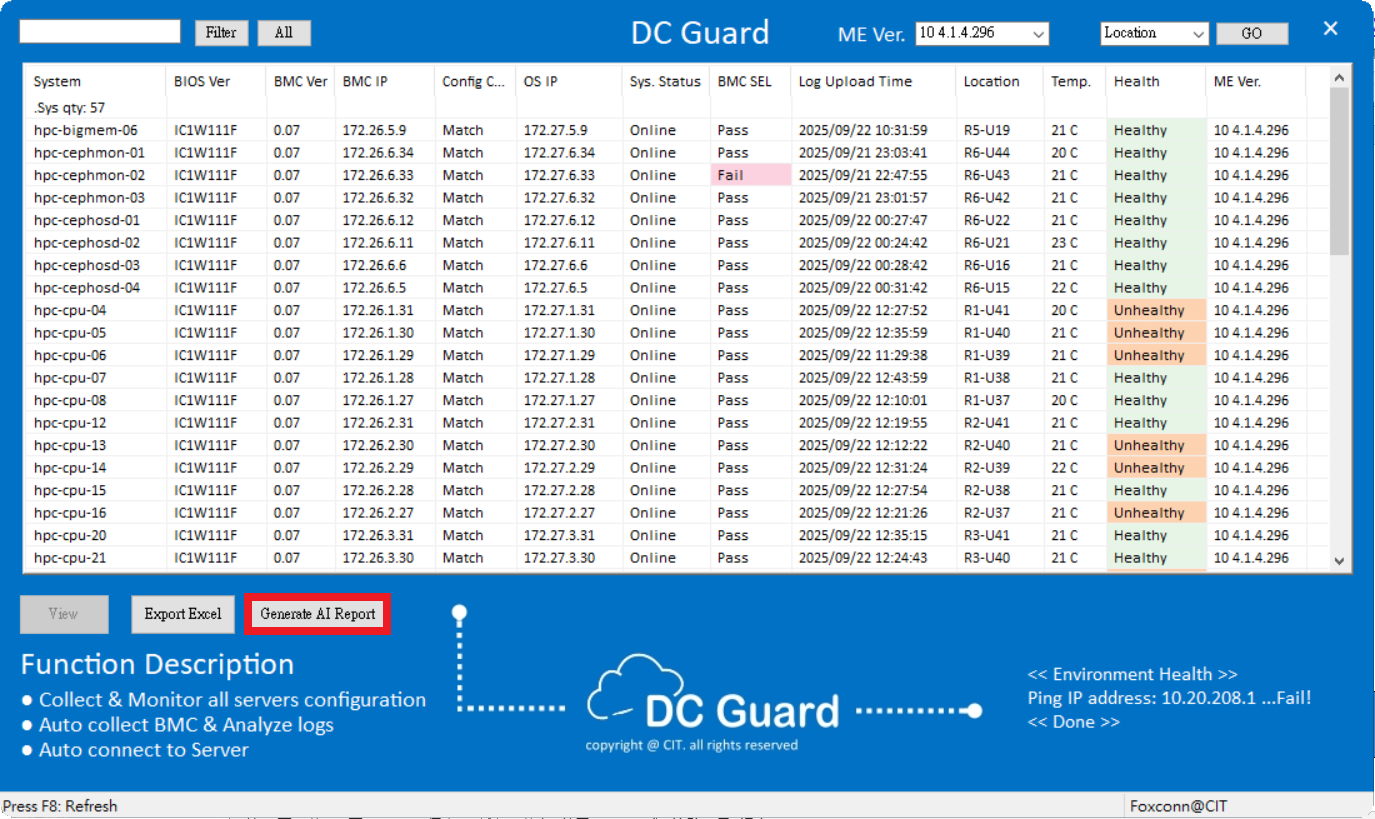
After generation, a consolidated .html file will automatically be downloaded to your desktop.
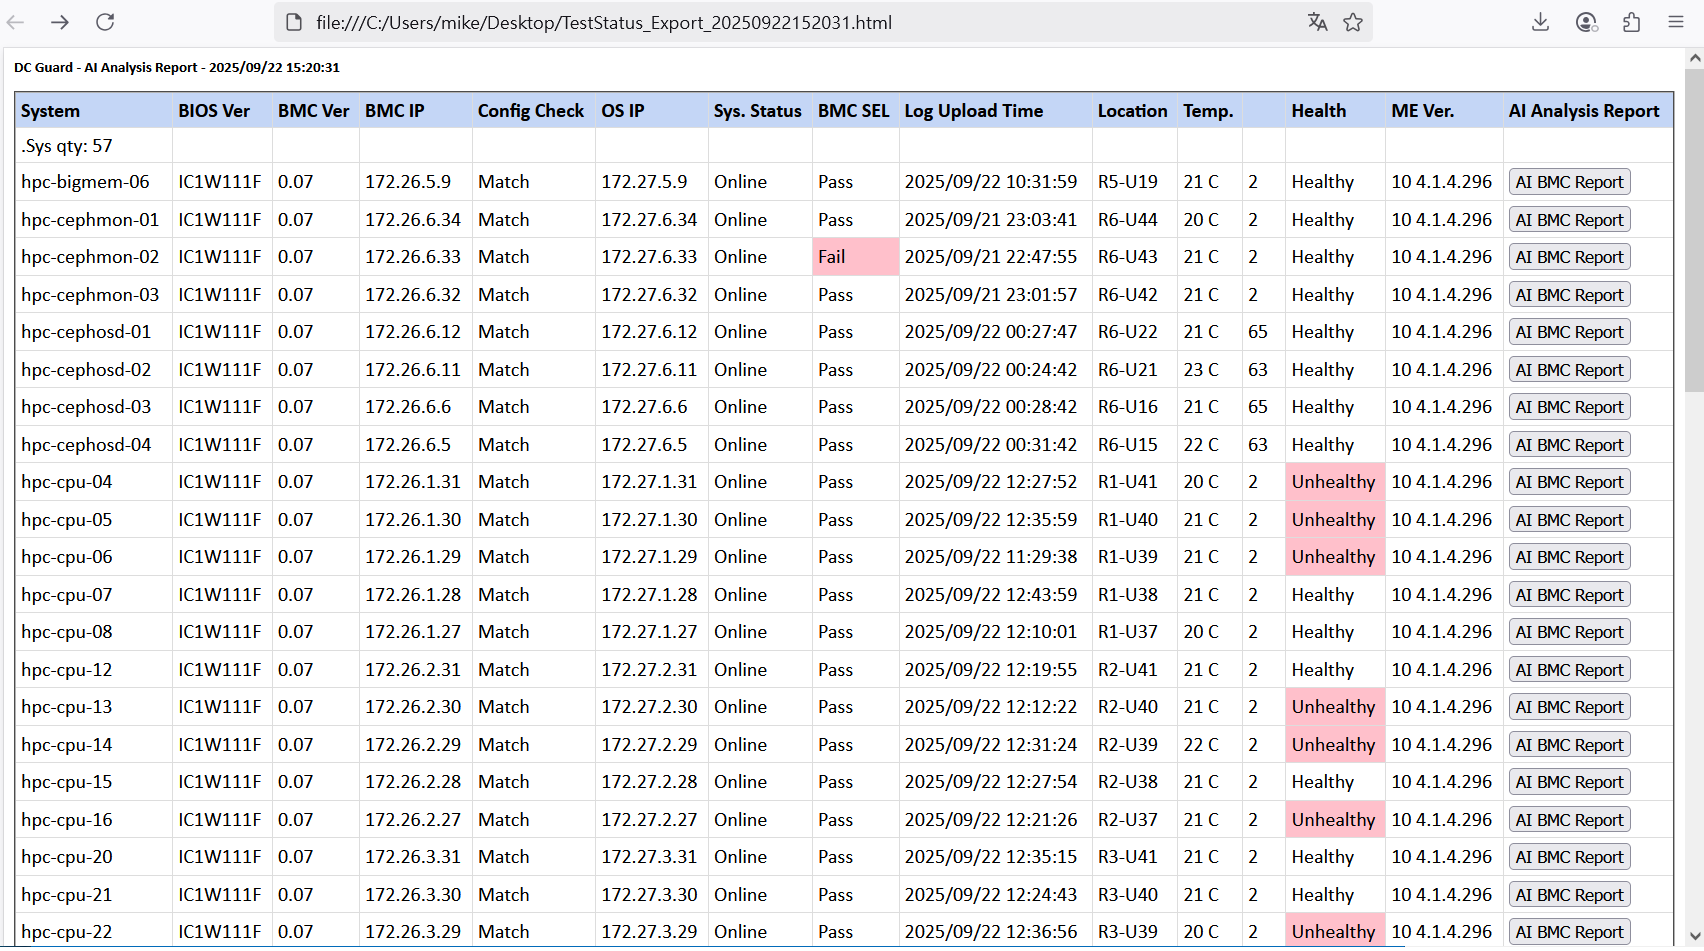
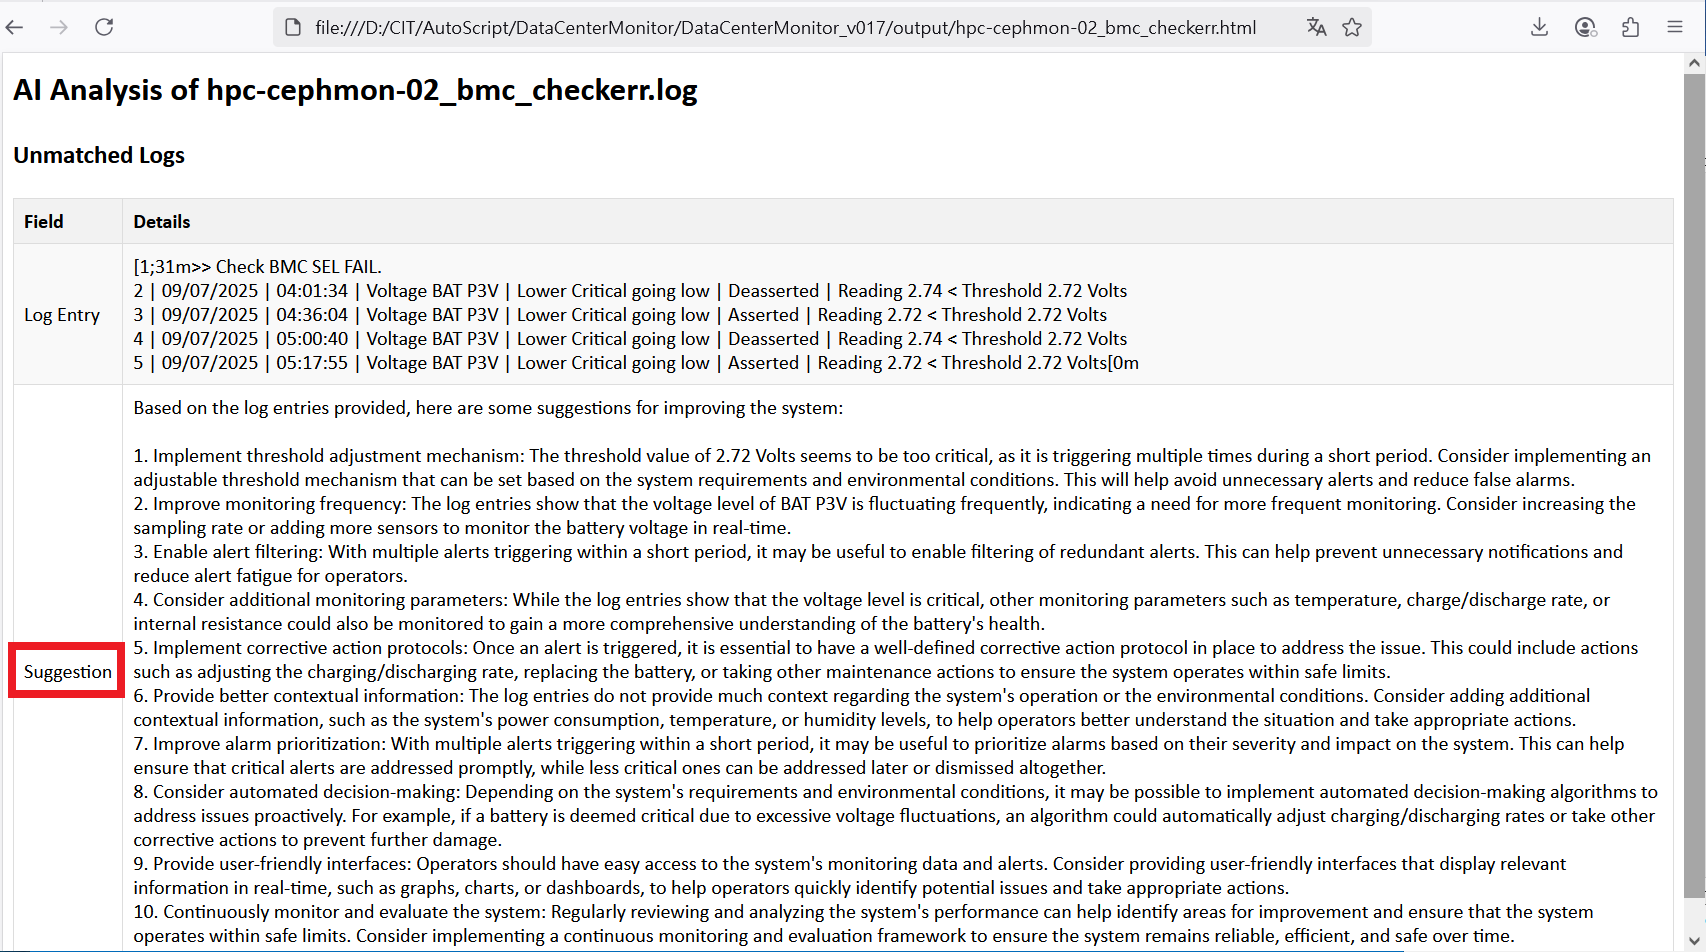
Click “AI BMC Report” on the right panel to view AI-generated suggestions for each monitored device.
SOL Auto Connection
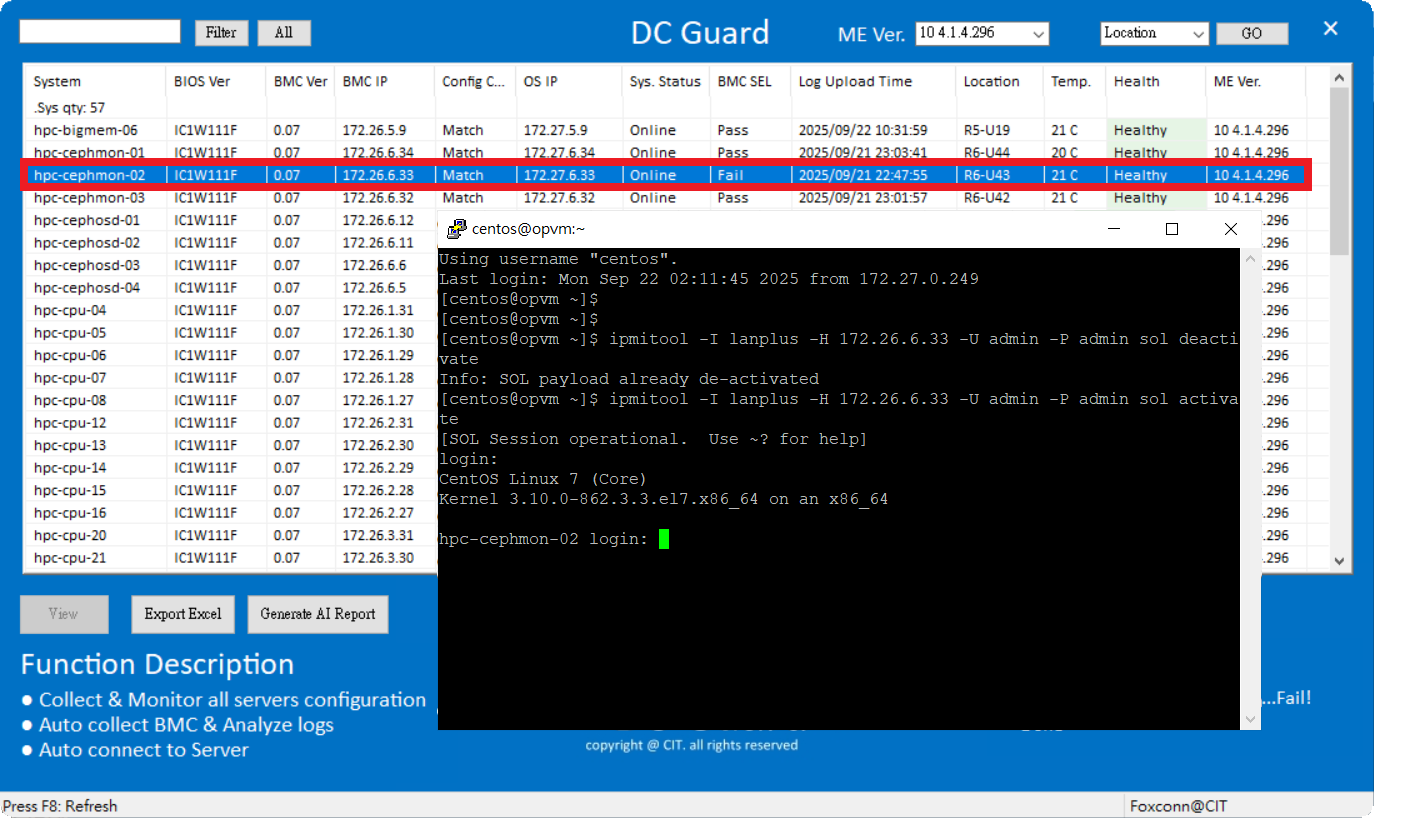
Double-click a monitored device to open BMC SOL session, allowing access to:
- BIOS
- Console/Logs
- Boot sequence monitoring
- Remote diagnostics and maintenance