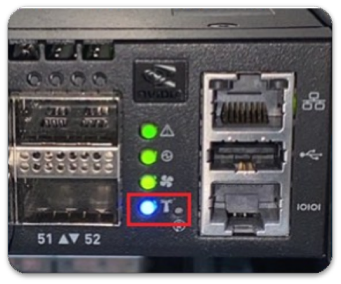
Switch Monitoring
Default Monitoring Parameters and Alert Triggers
| Parameter | Description | Threshold | Alert |
|---|---|---|---|
| Dmesg | Checks system hardware, drivers, and kernel-level errors such as temperature, ASIC, or interface failures. If abnormalities occur, they may result from kernel or driver-reported failures, probe errors, I/O operation failures, insufficient resources, or incompatibility. | Fail | ✓ |
| System Status (Sys. Check) | Confirms whether the monitored devices continuously upload or update logs within the specified time. The standard interval is 120 seconds. If no upload or update occurs, the possible cause may be device failure or shutdown. This is considered a critical incident and should be addressed immediately. | NoUpdate | ✓ |
| Temperature (Temp) | Monitors the overall temperature of the switch. If temperature exceeds the normal threshold, check whether the device or environmental temperature is abnormal. | > 60°C or < 10°C | ✓ |
| Fan | Checks fan module rotation speed. If abnormal, it may be due to incorrect fan configuration or fan aging. | < 2000 rpm | ✓ |
| Hardware Check (H.W. Check) | Checks individual hardware components, including power supply units (PSU), CPU fans, and temperature sensors. | Fail | ✓ |
Alert Notifications
By default, alerts are sent via email to your company’s designated contact.
If subscribed to the 24/7 NOC monitoring service, critical incidents trigger a phone call from DCT NOC team.
Viewing System Event Logs (SEL)
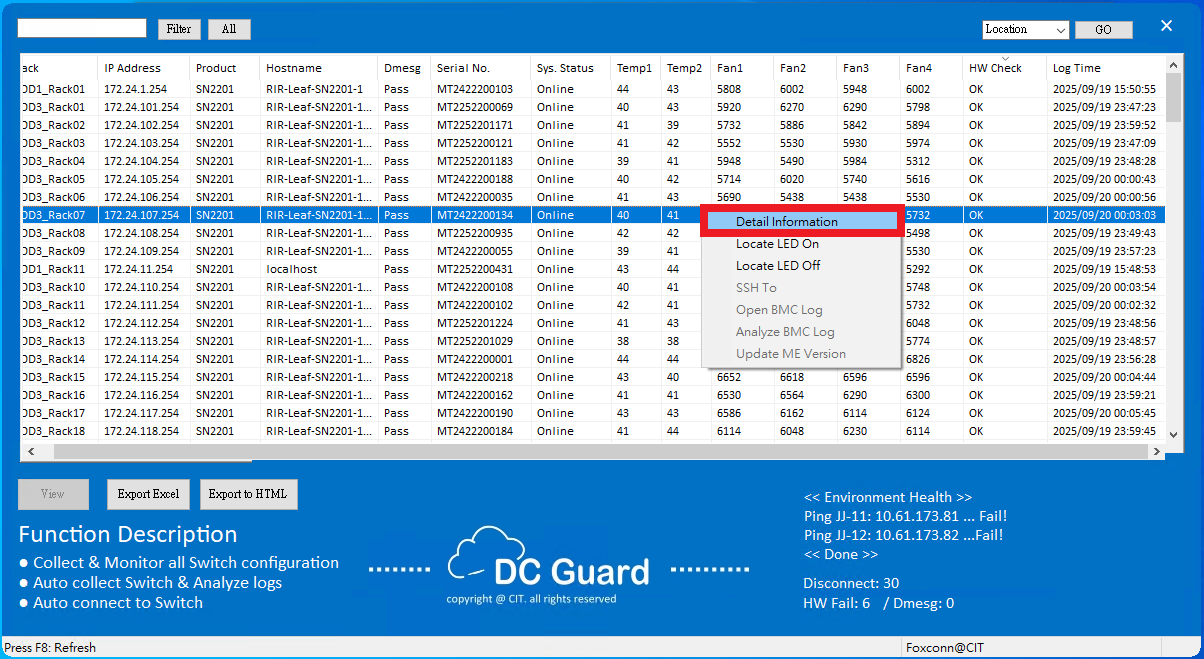
Right-click the affected device row → Detail Information to view the SEL log.
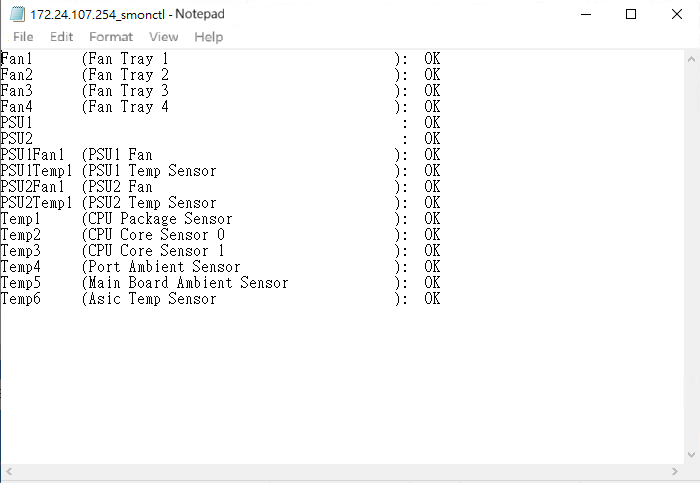
Identify error causes.
Remote Control & Locate LED
To locate an abnormal machine, right-click device too see the menu.
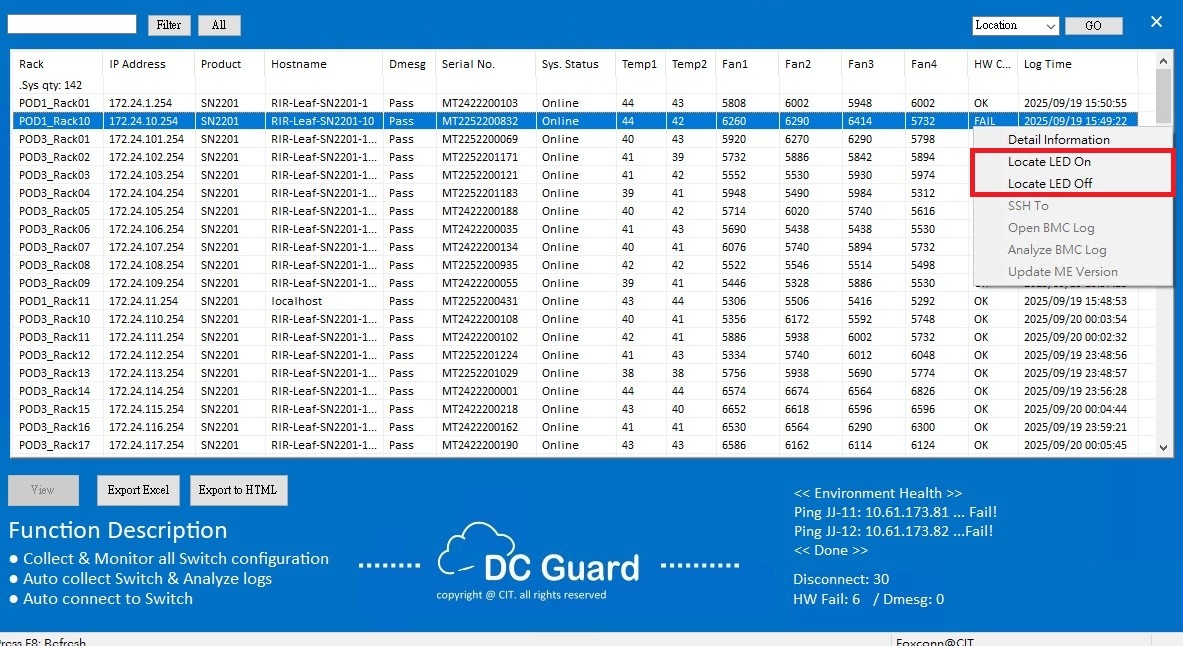
Locate LED On to remotely activate the machine’s LED.